Florida’s 67 county governments, 412 municipalities and approximately 1,000 special districts tax-and-spend more than $80 billion annually, more than half of all government spending in the state.
Florida law spells out quarterly reporting requirements for local governments through the state Department of Financial Services’ Local Government Electronic Reporting (LOGER) System.
Each local government and taxing district must file quarterly adjusted Annual Financial Reports (AFR) that allow taxpayers to essentially build their own report on a selected county, city or special district.
Efforts to impose more strident local government reporting requirements failed during this year’s legislative session.
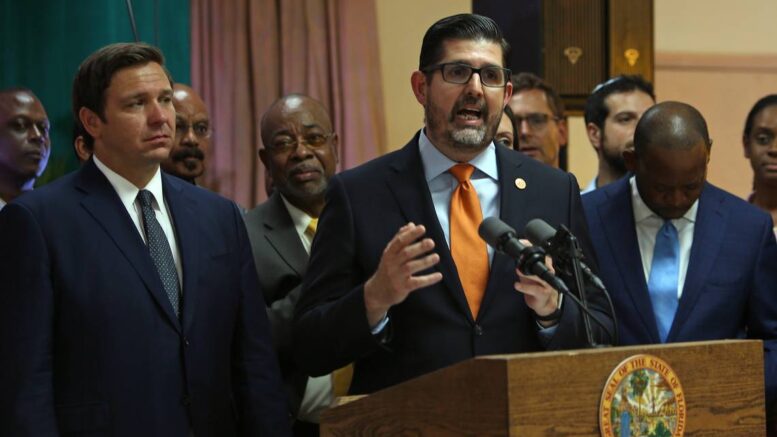
Senate Bill 154, the proposed ‘Local Government Fiscal Transparency Act,’ filed by Sen. Manny Diaz, Jr., R-Hialeah Gardens, never secured a House companion and was not heard in committee. Diaz submitted similar bills with similar fates the last few years.
SB 154 would expand Legislative Auditing Committee reviews to include compliance with local government fiscal transparency requirements, revised reporting requirements and mandated local governments post voting records on their websites.
Diaz’s bill stalled but the Florida Chamber of Commerce and Florida TaxWatch, the Tallahassee-based taxpayer advocacy nonprofit, offer interactive tools that provide comparative transparency into local government finances.
The Florida Chamber last week introduced a data tracker that businesses and taxpayers can use to chart post-pandemic economic recovery on a county-by-county basis.
The Chamber’s COVID-19 County Level Tracker posted on its TheFloridaScorecard.org website has been “replaced” by an interactive tool using “new data” that provides “a snapshot of metrics” charting 18 categories within 12 sections for each of Florida’s 67 counties.
“More than 60 local chambers along with county, city and economic development organizations” contributed to the COVID-19 tracker and will now provide economic data to the scorecard to be updated automatically on a regular basis, the Chamber said.
FloridaScorecard sections include Job Change, Children in Poverty, 3rd Grade Reading Scores, Unemployment Numbers, Unemployment Rate, Housing Permits, Sales Tax Revenues, “Wealth Migration,” Poverty Rate, High School Graduation Rate, Land In Conservation and Population.
Clicking randomly to Charlotte County, the county’s “Job Change” sector shows 12,242 more jobs, a 21.2% job growing rate, that housing permit applications are increasing but sales tax revenues down.
Among unique metrics is “Wealth Migration,” which is, “The amount of adjusted gross income this county gains or loses each year from people migrating into and out of the county.” In Charlotte Country, about $202.1 million migrates into the county each year, according to FloridaScorecard.
Each county’s page also includes a “FutureCast” button that shows 2030 population and “new jobs needed” forecasts. For Charlotte County, its 2030 projected population is 200,400 to 224,300 in 2030 with 8,213 “jobs needed.”
Florida TaxWatch’s How Counties Compare interactive tool allows the public to see where their county ranks in a range of metrics compared to the other 66 counties.
Built on LOGER system data, the tool classifies local government revenues into five categories: property taxes; other taxes; charges for services; permits, fees and special assessments; intergovernmental revenues; and other revenues.
Staying with Charlotte County as an example, it ranked 19th in per capita total property taxes ($1,579) statewide as of 2019 with per capita county ($830.26) the state’s eighth largest and per capita schools district taxes ($657.29) 17th highest in the state.
Charlotte County, which has only one incorporated city and is notable for its myriad municipal service benefit units (MSBUs) or assessment districts in which local boards on a neighborhood or subdivision basis.
Therefore, it is not surprising that using TaxWatch’s ‘How Counties Compare’ tool that Charlotte County is tops in the state for per capita fees and special assessments ($459.51) and second in the state for per capita district assessment revenues ($379.11).
This article was originally posted on Chamber tool casts light on local government fiscal management

Be the first to comment on "Chamber tool casts light on local government fiscal management"